
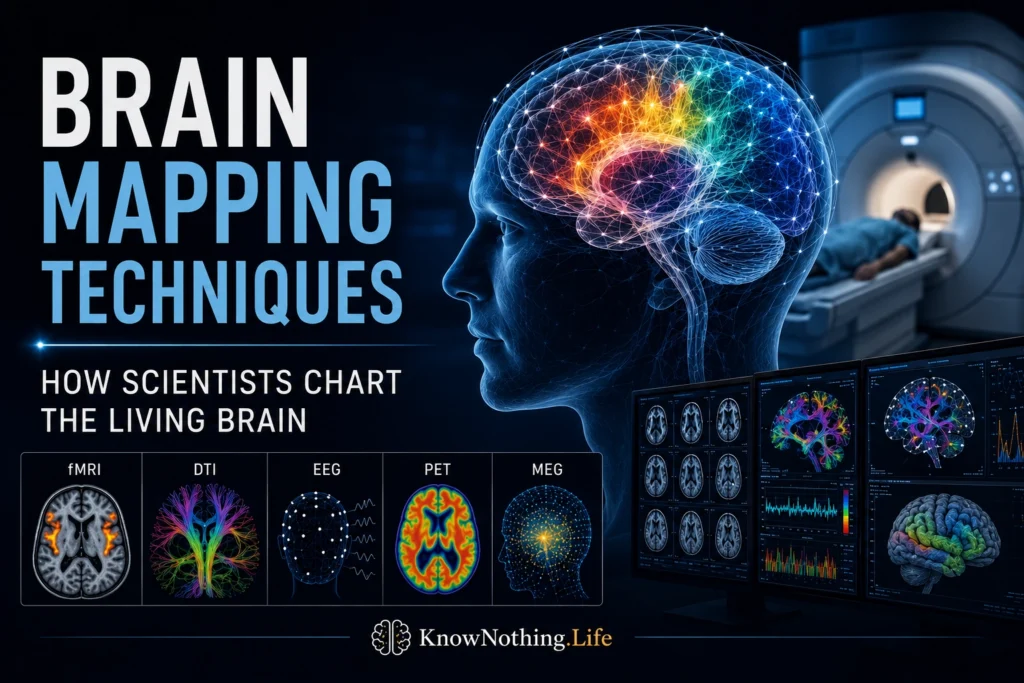
Brain mapping is not one procedure that produces a definitive picture of the mind. It is a broad scientific effort to describe where brain structures are located, how regions communicate, when neural activity occurs, and which cellular or molecular features distinguish one area from another. A map may show cortical anatomy, blood flow, electrical rhythms, white-matter pathways, receptor density, gene expression, or coordinated activity across distributed networks. Each type answers a different question, so modern neuroscience treats brain mapping as a multimodal enterprise in which anatomical, physiological, computational, and molecular evidence is aligned within a shared spatial framework.
This approach has moved neuroscience beyond simple diagrams that assign complex abilities to isolated cortical centers. Contemporary maps still recognize regional specialization, but they also emphasize networks, gradients, overlapping representations, and variation between individuals. Imaging-based parcellation can define regions through combinations of tissue structure, myelin content, connectivity, and task-related activity rather than through a single visible border. Eickhoff, Yeo, and Genon’s review of imaging-based brain parcellation describes the diversity of these boundaries as both a central challenge and an opportunity: the brain’s organization appears different depending on the property and scale being measured.
Structural MRI and Anatomical Mapping
Magnetic resonance imaging is the foundation of many current brain maps because it produces detailed views of soft tissue without using ionizing radiation. Structural MRI distinguishes gray matter, white matter, cerebrospinal fluid, blood vessels, and many pathological changes. T1-weighted scans are commonly used to estimate cortical thickness, regional volume, and the shape of subcortical structures, while T2-weighted and quantitative sequences reveal complementary tissue properties. Researchers can reconstruct the folded cortical surface, align individual brains to standardized coordinate systems, and compare anatomy across ages, populations, or clinical conditions. These procedures support atlases that represent both average human organization and the considerable variation that an average may conceal.
Structural mapping becomes more informative when several MRI contrasts are combined. Differences between T1- and T2-weighted signals can provide indirect information about cortical myelination, while quantitative MRI attempts to estimate physical tissue characteristics more directly. In the 2016 study “A Multi-Modal Parcellation of Human Cerebral Cortex,” Matthew Glasser and colleagues combined cortical architecture, function, connectivity, and topography to identify 180 areas in each cerebral hemisphere. The study did not imply that every person possesses identical cortical borders. Instead, it demonstrated that converging measurements can create a more biologically grounded and individually adaptable map than any single scan or traditional anatomical atlas.
Functional MRI and Positron Emission Tomography
Functional magnetic resonance imaging maps changes associated with neural activity by measuring hemodynamic responses. Most fMRI studies use the blood-oxygen-level-dependent, or BOLD, signal, which reflects changes in the magnetic properties of blood as oxygenation varies. Seiji Ogawa and colleagues established the basis of BOLD contrast in 1990, showing that deoxygenated hemoglobin could act as a naturally occurring source of MRI contrast. Jack Belliveau and his collaborators soon demonstrated functional mapping of the human visual cortex with MRI. In task-based fMRI, researchers compare signals recorded during different conditions to identify regions whose activity reliably changes. Its whole-brain coverage and useful spatial resolution are major strengths, but the signal remains indirect because it measures vascular consequences associated with neural activity rather than electrical firing itself.
Resting-state fMRI maps functional networks without requiring participants to perform a specific task. In 1995, Bharat Biswal and colleagues discovered correlated low-frequency fluctuations in distant motor regions while participants rested, helping establish that spontaneous activity could reveal functional connectivity. This approach later supported maps of large-scale systems associated with vision, movement, attention, memory, and internally directed thought. Positron emission tomography, or PET, played a foundational role in functional brain mapping and remains valuable because radioactive tracers can measure cerebral blood flow, glucose metabolism, neurotransmitter receptors, or disease-related proteins. PET offers molecular specificity that conventional fMRI cannot provide, although radiation exposure, cost, and temporal limitations restrict repeated use.
EEG, MEG, and Neural Timing
Electroencephalography records voltage changes at the scalp produced by synchronized neural currents. Its greatest strength is temporal resolution: EEG can track brain activity on the millisecond scale, making it useful for studying perception, attention, decision-making, sleep, seizures, and the sequence of processing that follows a stimulus. Event-related potentials isolate recurring patterns associated with particular events, while frequency analysis examines oscillations such as theta, alpha, beta, and gamma rhythms. Yet electrical signals are distorted as they pass through brain tissue, cerebrospinal fluid, skull, and scalp. Determining their origin is therefore an inverse problem, and even high-density EEG maps depend on anatomical head models, electrode placement, and computational assumptions.
Magnetoencephalography measures the extremely small magnetic fields generated by neuronal currents. Like EEG, MEG provides millisecond timing, but magnetic fields are less distorted by the skull and scalp, which can improve localization for certain cortical sources. It is especially useful for tracing sensory responses, language processing, oscillatory networks, and epileptic activity. MEG nevertheless requires expensive, magnetically shielded equipment, and its source estimates remain dependent on mathematical models. The technique therefore complements rather than replaces fMRI: hemodynamic imaging usually offers finer spatial detail and fuller coverage of deep and superficial structures, whereas EEG and MEG reveal how quickly activity begins, changes, and spreads through a network.
Diffusion MRI and Connectome Mapping
Diffusion MRI maps aspects of white-matter organization by measuring the movement of water through tissue. Because water generally diffuses more easily along axonal bundles than across them, diffusion measurements can be used to estimate local fiber orientations. Tractography algorithms connect these estimates into probable pathways, producing three-dimensional models of major white-matter tracts. Early diffusion tensor imaging worked best where fibers followed a dominant direction, while multi-shell acquisitions and newer fiber-orientation models better address regions where pathways cross, bend, or branch. Researchers use these maps to investigate brain development, aging, learning, injury, and connectivity differences associated with neurological or psychiatric conditions.
The Human Connectome Project accelerated this work by collecting high-quality structural, diffusion, resting-state, and task-based MRI data designed to map macroscale human brain connections. Connectome analysis represents brain regions as nodes and their structural or functional relationships as edges, allowing network science to study hubs, modules, integration, segregation, and communication efficiency. However, tractography does not directly photograph axons. It infers pathways from patterns of water diffusion and can generate false-positive as well as false-negative connections. Reviews by Shi and Toga, along with wider evaluations of tractography, emphasize that improved acquisition, mathematical modeling, multimodal comparison, and anatomical validation are necessary before a reconstructed connectome can be treated as a complete wiring diagram.
Cellular Maps and Multimodal Integration
The most detailed brain maps are often produced from tissue rather than living scans. Histology can reveal cell bodies, cortical layers, myelinated fibers, and microscopic boundaries that remain beyond the resolution of routine in vivo imaging. Modern digital methods extend classical cytoarchitecture through automated image analysis, three-dimensional reconstruction, and probabilistic atlases. Single-cell sequencing and spatial transcriptomics now add molecular identity, classifying cells through gene-expression patterns and locating those cell types within tissue. Recent brain-cell atlas projects have integrated data from millions of cells and nuclei across numerous brain regions, revealing extensive biological diversity inside structures that may appear comparatively uniform on an MRI scan.
No technique captures every relevant property of the brain. Structural MRI offers broad anatomical coverage but limited cellular detail. Functional MRI provides spatial maps of a delayed vascular response. PET can target particular molecules but requires radioactive tracers. EEG and MEG capture rapid neural dynamics but face difficult source-localization problems. Diffusion MRI estimates rather than directly observes axonal pathways, while microscopic and molecular methods generally require sampled or postmortem tissue. The future therefore lies in multimodal atlases that combine anatomy, connectivity, hemodynamics, electrophysiology, behavior, gene expression, and cellular identity. A brain map is always a model shaped by its measurement method and intended purpose. Its scientific value depends not on appearing final, but on stating clearly what was measured, how boundaries were defined, and where uncertainty remains.