
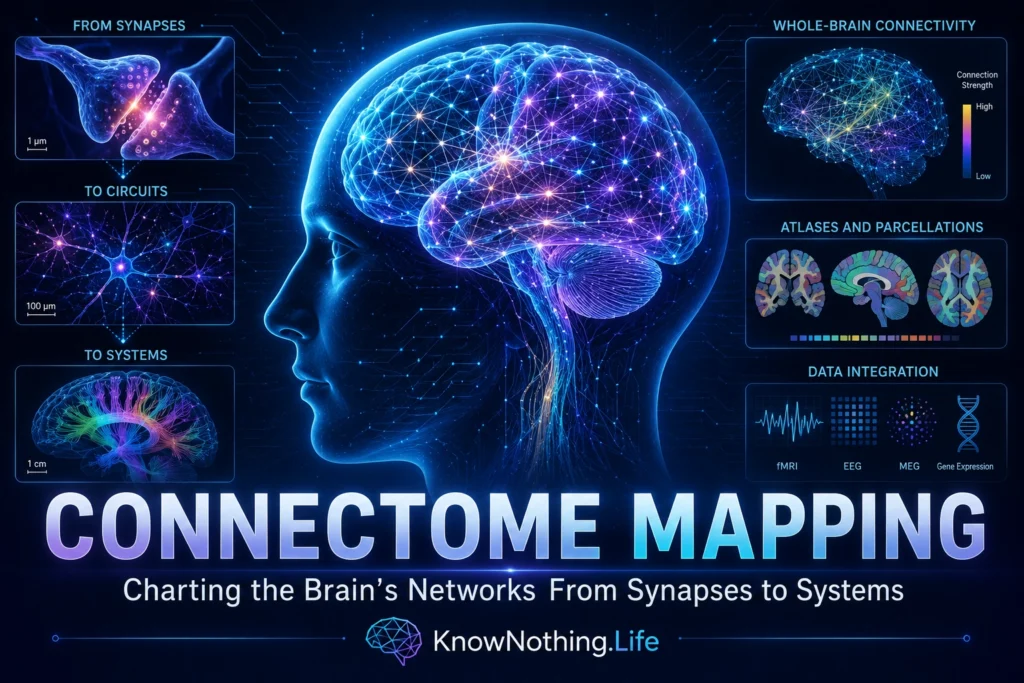
Connectome mapping is the effort to describe how the components of a nervous system are connected. The resulting network map is called a connectome, a term introduced into modern neuroscience by Olaf Sporns, Giulio Tononi, and Rolf Kötter in their influential 2005 paper, “The Human Connectome: A Structural Description of the Human Brain.” In a connectome, neurons, cell populations, or anatomical regions are represented as nodes, while the connections between them are represented as edges. A map may therefore describe every synapse in a small nervous system, the major white-matter pathways linking human brain regions, or patterns of coordinated activity observed during rest and behavior.
A connectome is not a single fixed type of diagram. Structural connectivity describes physical pathways, functional connectivity measures statistical relationships between activity in different locations, and effective connectivity attempts to estimate how one neural element influences another. Each approach captures a different aspect of organization. The complete architecture of a brain also exists across many scales, from microscopic synapses to long-range networks spanning both hemispheres. Connectome mapping attempts to unite these levels without assuming that anatomy alone can fully explain thought or behavior.
The First Complete Neural Wiring Diagram
The first complete cellular wiring diagram of an animal nervous system came from the nematode Caenorhabditis elegans. In 1986, John White, Eileen Southgate, John Thomson, and Sydney Brenner published a reconstruction based on serial electron microscopy. By following neurons through thousands of ultrathin tissue sections, the researchers documented the positions, processes, chemical synapses, and electrical junctions of the worm’s compact nervous system. The achievement demonstrated that an entire nervous system could be analyzed as an interconnected network rather than as a collection of isolated reflexes.
The worm connectome also showed why a wiring diagram cannot be treated as a complete explanation of behavior. Neurons connected in the same anatomical pattern may respond differently depending on sensory conditions, neuromodulators, developmental stage, prior activity, and synaptic strength. Later research has also revealed individual and developmental variation in the worm’s nervous system. A connectome is therefore best understood as a structural framework that constrains possible communication. It shows where signals may travel, but not necessarily when they travel, how strongly they are transmitted, or what an animal will do.
Mapping the Living Human Brain
Human connectome mapping relies mainly on noninvasive imaging because electron microscopy cannot be used to reconstruct every synapse in a living human brain. Diffusion magnetic resonance imaging measures how water molecules move through white matter, and tractography algorithms use those measurements to estimate the paths of major fiber bundles. Functional MRI measures changes in blood oxygenation and identifies regions whose activity rises and falls together. Electroencephalography and magnetoencephalography measure neural activity more rapidly, although they generally provide less precise anatomical localization.
The Human Connectome Project transformed these methods into a coordinated population-scale research program. David Van Essen and colleagues described a project designed to collect structural, diffusion, resting-state, task-based, and behavioral data from approximately 1,200 healthy adults, including twins and siblings. The initiative improved imaging hardware, preprocessing, cortical alignment, and open-data practices. It also created a widely used reference for studying how normal brain connectivity varies across people and relates to cognition, behavior, genetics, and development.
In 2016, Matthew Glasser and colleagues used Human Connectome Project data to produce a multimodal map of the cerebral cortex. By combining cortical architecture, functional specialization, connectivity, and topographic organization, the researchers divided each hemisphere into 180 areas. Ninety-seven of those regions had not previously been established using the same combination of evidence. The study illustrated how connectome mapping can refine the traditional practice of dividing the brain according to visible folds or a single measurement method.
Networks, Modules, and Brain Hubs
Once neural connections have been represented as a matrix, researchers can apply graph theory to examine the brain’s organization. Graph analysis measures features such as clustering, path length, modularity, centrality, and network efficiency. Modules are groups of regions that communicate densely with one another, often supporting related functions. Hubs are unusually connected or strategically positioned regions that help exchange information among otherwise separate networks. This architecture may allow the brain to balance specialization with integration.
In 2008, Patric Hagmann and colleagues used diffusion imaging to investigate the large-scale structural organization of the human cerebral cortex. Their analysis identified a densely connected core concentrated in posterior medial and parietal regions. These areas communicated extensively with one another and with several other cortical systems, suggesting that they support broad integration across the brain. Subsequent connectome research has described related “rich-club” organization, in which highly connected hubs form disproportionately strong connections with other hubs.
Hub organization may make neural communication efficient, but it can also create vulnerability. Damage to a peripheral node may disturb a limited process, while damage to a central hub can affect several networks at once. Researchers have therefore studied whether neurological and psychiatric disorders involve disrupted connections among hubs, reduced modular organization, or compensatory rerouting. Such findings remain primarily group-level observations and should not be interpreted as simple diagnostic signatures for individual patients.
Mapping Synapses With Electron Microscopy
Microscopic connectome mapping requires images detailed enough to distinguish membranes, axons, dendrites, and synapses. Tissue is preserved and imaged in extremely thin layers using electron microscopy. Computational systems then align the images, segment cells, trace neuronal processes, and identify probable synaptic contacts. Machine learning has greatly accelerated this work, but human proofreading remains necessary because a single mistaken split or merge can alter thousands of inferred connections.
In 2023, Michael Winding and colleagues published a synaptic-resolution connectome of the entire larval fruit-fly brain. The map contained 3,016 neurons and approximately 548,000 synapses. It revealed extensive feedback, recurrent processing, cross-hemisphere connections, and multiple pathways linking sensory inputs to learning and action-selection systems. Some of its organizational features, including parallel pathways and nested recurrent loops, resembled principles used in artificial neural networks.
The scale increased dramatically in 2024 when Sven Dorkenwald and the FlyWire Consortium reported a wiring diagram of an adult female fruit-fly brain. The reconstruction contained 139,255 neurons and roughly 50 million chemical synapses. Artificial intelligence was used to produce an initial segmentation, while researchers and trained contributors corrected errors and identified neuronal types. The map became the largest complete synaptic connectome of an adult animal produced at that time.
Connecting Brain Structure With Function
A structural connectome becomes more informative when researchers can measure what its neurons do. Functional connectomics combines anatomical reconstruction with activity recordings collected while an animal processes stimuli, makes decisions, or performs movements. Researchers can then investigate whether neurons with similar responses are preferentially connected, how inhibitory cells control information flow, and how local circuits communicate across regions.
The MICrONS Consortium reported a major advance in 2025 by combining neural activity measurements from an awake mouse with a large electron-microscopy reconstruction of its visual cortex. Calcium imaging recorded responses from approximately 75,000 neurons while the mouse viewed natural and artificial visual stimuli. The corresponding anatomical dataset contained more than 200,000 cells and approximately half a billion synapses. By matching functional recordings with reconstructed neurons, the researchers could compare what particular cells responded to with the connections they formed.
The reconstructed volume covered only about one cubic millimeter of cortex, demonstrating both the power and difficulty of mammalian connectomics. Even a small portion of mouse brain tissue contains an enormous number of cellular structures and synaptic relationships. The project also required extensive automated processing, repeated proofreading, cloud-based storage, and tools that allow scientists to analyze selected portions of the data without downloading the entire reconstruction.
What Connectome Maps Can Reveal
Connectome maps provide a framework for comparing individuals, developmental stages, species, and disease states. Researchers can examine how networks mature during childhood, reorganize after injury, or change with aging. A lesion may disrupt communication between regions that remain structurally intact, while abnormal development may alter the formation of distributed networks without producing one obvious damaged location. Connectivity has consequently been investigated in stroke, epilepsy, multiple sclerosis, traumatic brain injury, Alzheimer’s disease, schizophrenia, autism, and disorders of consciousness.
Clinical applications remain experimental. Network information may eventually improve surgical planning, brain-stimulation targeting, prognosis, and personalized rehabilitation. However, an observed connection difference can reflect a cause of illness, a consequence of illness, medication, compensation, head movement, or the analytical method used. Models must be reproduced across scanners, research centers, and diverse populations before they can become dependable clinical tools. A visually complex brain network is not automatically an accurate explanation of a disorder.
The Limitations of Current Connectome Mapping
Diffusion tractography is especially vulnerable to overinterpretation because it does not observe axons directly. It estimates pathways from local patterns of water movement. Fibers may cross, branch, bend, or converge within the same imaging voxel, leaving several plausible ways to connect one region with another. In a 2017 international challenge, Klaus Maier-Hein and colleagues found that advanced tractography methods recovered most of the known fiber bundles in a simulated brain but also produced more invalid than valid bundles. Several false pathways appeared consistently across research groups.
Microscopic maps have different limitations. Electron microscopy produces a static image of preserved tissue and does not directly reveal electrical activity, neurotransmitter concentrations, receptor sensitivity, synaptic strength, hormonal conditions, or the changing influence of glial cells. Connectomes also represent particular brains at particular moments. Neural connections are created, removed, strengthened, and weakened throughout life. Mapping every synapse in the human brain would additionally require extraordinary imaging capacity, data storage, computational processing, and manual verification.
The Future of Connectome Mapping
Future progress will depend on combining several kinds of information rather than waiting for one perfect map. Higher-resolution diffusion imaging, improved tractography constraints, molecular labeling, automated electron-microscopy segmentation, single-cell sequencing, and large-scale neural recordings may connect macroscopic pathways with particular cell types and synapses. Repeated measurements could show how networks change during learning, treatment, aging, and recovery.
The ultimate purpose of connectome mapping is not to create the most complicated diagram possible. It is to discover which features of neural organization matter for perception, memory, movement, emotion, and behavior. A connectome resembles a road map: it shows possible routes and major intersections, but it does not reveal every traveler, traffic signal, destination, or reason for making a journey. By combining connectivity with physiology, chemistry, development, and behavior, neuroscience can move from describing where connections exist to understanding what those connections allow a living brain to do.