
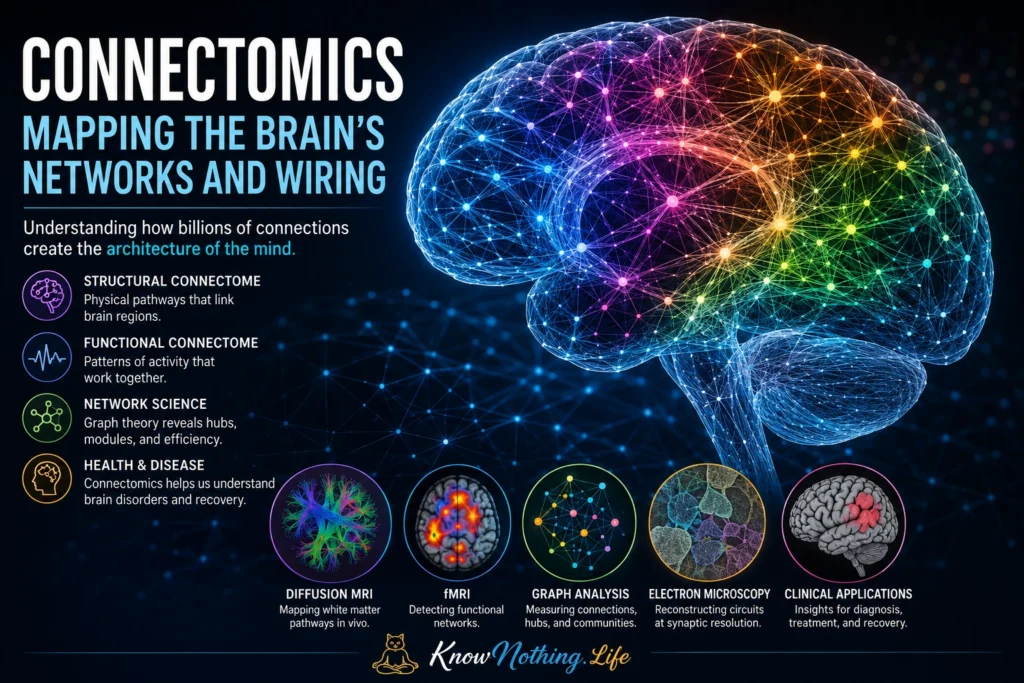
Connectomics is the scientific study of the brain’s connections as organized networks. Rather than examining one neuron, pathway, or brain region in isolation, it asks how large numbers of neural elements are linked and how their collective organization supports perception, memory, emotion, movement, and consciousness. A connectome is therefore a map of neural connections within a nervous system. Depending on the research question, it may describe individual synapses between neurons, pathways between populations of cells, or large-scale communication between anatomical regions. The term gained prominence through Olaf Sporns, Giulio Tononi, and Rolf Kötter’s 2005 paper, The Human Connectome: A Structural Description of the Human Brain, which argued that understanding brain function requires a systematic account of its connection matrix.
A connectome is sometimes compared to a wiring diagram, but the analogy is incomplete. Electrical diagrams usually describe fixed components with predictable functions, whereas biological connections change through development, experience, learning, aging, and disease. The strength and effectiveness of a neural connection may also depend on neurotransmitters, receptor types, timing, cellular state, and previous activity. Connectomics does not claim that wiring alone explains the mind. Instead, it provides a structural and functional framework for investigating how activity travels through the brain and why damage to one location can affect distant systems.
Structural and Functional Connectomes
A structural connectome represents physical neural pathways. At the microscopic level, it may identify individual neurons and the synapses connecting them. At intermediate scales, it can trace projections between cell populations or anatomical structures. In living humans, structural connectivity is usually estimated with diffusion MRI, which measures patterns in the movement of water through white matter. Tractography algorithms use those measurements to reconstruct probable fiber pathways between brain regions. Patric Hagmann and colleagues applied diffusion imaging to produce a large-scale map of human cortical connections in their 2008 study Mapping the Structural Core of Human Cerebral Cortex. Their analysis identified highly connected posterior medial and parietal regions that appeared to act as connector hubs between major cortical modules.
A functional connectome describes statistical relationships between patterns of activity rather than direct anatomical links. Functional MRI researchers often examine whether the blood-oxygen-level-dependent signals of two regions rise and fall together. EEG and MEG can also estimate functional relationships through synchronized electrical or magnetic activity. Two areas may display functional connectivity even when no direct anatomical pathway has been demonstrated because their activity may be coordinated through intermediate regions or shared inputs. Functional connections are also more dependent on mental state. Networks observed during rest may reorganize when a person speaks, remembers, makes a decision, or performs a movement.
Building the Human Connectome
The Human Connectome Project transformed human connectomics by creating standardized, high-quality datasets that combined structural MRI, diffusion imaging, resting-state fMRI, task-based fMRI, behavioral measurements, and genetic information. The WU-Minn consortium planned to study approximately 1,200 healthy adults, including twins and siblings, so researchers could investigate both population-level organization and individual variation. David Van Essen and colleagues described the project as a systematic effort to map macroscopic human brain circuits and relate them to behavior. Its open datasets also encouraged laboratories around the world to test new processing methods without independently collecting equally extensive imaging samples.
Human connectome construction requires the brain to be divided into meaningful regions called nodes. The connections between those nodes are represented as edges, which may be weighted according to estimated pathway strength, signal correlation, or another measurement. Selecting the nodes is not a neutral step because a network can look different when researchers use broad anatomical divisions instead of smaller functional areas. Matthew Glasser and colleagues addressed this problem in their 2016 multimodal cortical parcellation, combining architecture, connectivity, function, and topography to identify 180 areas in each cerebral hemisphere. The work demonstrated that brain boundaries become more reliable when several forms of evidence converge.
Network Science and Brain Organization
Connectomics draws heavily on graph theory, a branch of mathematics used to analyze relationships among connected elements. Researchers can measure how many connections a node possesses, how efficiently information may travel across the network, and whether the connectome is divided into communities or modules. Many brain networks appear to balance segregation and integration. Specialized modules allow groups of regions to process related information, while long-range pathways and connector hubs allow those modules to cooperate. This arrangement may enable the brain to maintain specialized systems without becoming a collection of isolated processors.
Some highly connected regions form what researchers call hubs or rich clubs. These areas participate in many pathways and may support communication among otherwise separate networks. Their centrality can make them valuable, but it may also make them vulnerable: damage to a hub can disturb a wider range of functions than damage to a more peripheral node. The structural core reported by Hagmann and colleagues included regions associated with the brain’s default network, linking connectome organization to systems involved in memory, internal thought, and self-referential processing. Connectomics therefore shifts attention from locating a function in one region toward understanding how coordinated systems produce behavior.
From Worms to Whole-Brain Connectomes
The first complete neuronal wiring diagram was produced for the nematode Caenorhabditis elegans. John White, Eileen Southgate, John Thomson, and Sydney Brenner reconstructed its nervous system from serial electron micrographs in their landmark 1986 work The Structure of the Nervous System of the Nematode Caenorhabditis elegans. The project required tracing neurons through thousands of microscopic sections and documenting their chemical synapses and gap junctions. Although the worm has a small nervous system compared with mammals, its connectome established that an entire neuronal network could be reconstructed at synaptic resolution.
Larger animals require much greater imaging capacity, data storage, automated segmentation, and human proofreading. The Allen Mouse Brain Connectivity Atlas used viral tracers and serial two-photon tomography to create a brain-wide mesoscale map of axonal projections in the mouse. In 2024, Sebastian Dorkenwald and the FlyWire consortium reported a wiring diagram of an adult fruit-fly brain containing 139,255 neurons and approximately 50 million chemical synapses. The fly project combined electron microscopy, machine learning, expert annotation, and community proofreading, illustrating how connectomics has become both a technological and collaborative form of large-scale science.
Individual Connectomes and Human Differences
No two human connectomes are exactly identical. Genes influence brain development, but experience, education, stress, injury, practice, and aging also modify connectivity. Even when people share the same major anatomical pathways, they may differ in connection strength, network organization, or the boundaries between functional systems. These differences complicate efforts to create one universal brain map, but they also make connectomics valuable for studying individuality.
Emily Finn and colleagues demonstrated this potential in their 2015 study of functional connectome fingerprinting. Using Human Connectome Project data, the researchers showed that patterns of functional connectivity could identify individuals across separate scanning sessions and even across resting and task conditions. The frontoparietal network was particularly distinctive, and some connectivity patterns were associated with differences in cognitive performance. The study suggested that connectomes can be investigated not only as group averages but also as individual profiles, although responsible prediction requires large samples, replication, and protection of sensitive neural data.
Connectomics in Neurology and Psychiatry
Many neurological and psychiatric disorders affect distributed networks rather than one isolated structure. Alzheimer’s disease, schizophrenia, epilepsy, traumatic brain injury, Parkinson’s disease, and depression have all been studied through changes in structural or functional connectivity. A connectome-based approach can reveal how local pathology influences communication across the brain, why similar lesions sometimes produce different symptoms, and how compensatory pathways may support recovery. It may eventually help clinicians select targets for surgery, deep brain stimulation, rehabilitation, or noninvasive stimulation based on a patient’s network organization.
Clinical interpretation remains difficult because an altered connection may be a cause of illness, a consequence of it, a compensatory response, or an unrelated individual difference. Functional connectivity is especially sensitive to motion, alertness, medication, analysis choices, and physiological signals. Group-level differences may also fail to produce accurate diagnoses for individual patients. Connectomics is therefore most useful when integrated with symptoms, cognitive testing, genetics, cellular biology, and longitudinal observation rather than treated as a stand-alone explanation of disease.
Limitations and the Future of Connectomics
Every connectome is shaped by its measurement method and scale. Diffusion tractography does not directly observe axons; it infers probable pathways from water diffusion and can produce both missing and false connections. Klaus Maier-Hein and colleagues demonstrated that major ambiguities persist even when tractography is supplied with highly accurate fiber-orientation information. Functional connectivity also does not prove direct communication or causation. At microscopic scales, electron microscopy can reveal synapses but usually captures preserved tissue at a particular moment, not the changing physiology of a living nervous system.
The future of connectomics lies in combining structural wiring with neural activity, cell type, gene expression, neurotransmitter identity, development, and behavior. Artificial intelligence will continue to accelerate image segmentation and pathway reconstruction, but expert validation will remain essential. Increasingly detailed maps may support personalized models of brain function, yet no map should be mistaken for a complete account of a person. The connectome provides the architecture through which neural processes unfold; understanding the mind also requires explaining the dynamic signals, biological states, and lived experiences that continually reshape that architecture.