
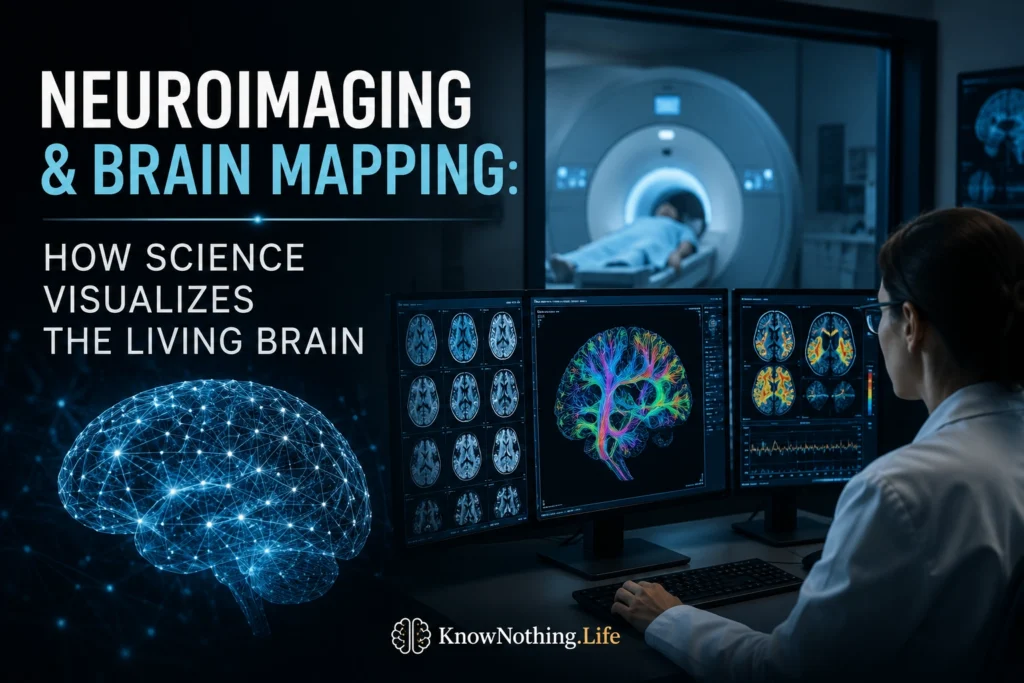
Brain mapping began as an effort to divide the nervous system into meaningful regions. Early investigators relied on lesions, postmortem anatomy, electrical stimulation, and microscopic differences in cortical tissue to infer what particular areas might do. Modern neuroimaging expanded that project by allowing researchers to examine the living brain repeatedly and noninvasively. The goal is no longer simply to label structures. Scientists now describe how anatomy, blood flow, metabolism, electrical activity, and communication networks change across tasks, diseases, development, and individual lives. A brain map is therefore not a direct picture of thought but a model linking measured biological signals to hypotheses about neural organization.
Rather than searching only for the location of memory, language, attention, or emotion, scientists increasingly study how distributed systems cooperate to produce them. Structural maps reveal tissue and pathways, functional maps identify activity associated with behavior, connectivity maps describe relationships among regions, and molecular imaging can measure selected receptors or proteins. Each technique captures a different level of organization. The strongest conclusions usually emerge when several methods converge instead of when one colorful scan is treated as a complete explanation of the mind.
Structural MRI and the Architecture of the Brain
Magnetic resonance imaging produces detailed images of soft tissue without ionizing radiation. Structural MRI can distinguish gray matter, white matter, cerebrospinal fluid, cortical thickness, subcortical nuclei, lesions, and other anatomical features. Computational methods reconstruct the folded cortical surface, align brains across participants, and estimate regional volume or thickness. Dale, Fischl, and Sereno’s influential 1999 work on automated cortical surface reconstruction helped establish techniques that became central to large-scale neuroimaging. These tools allow anatomy to be compared across development, aging, neurological illness, psychiatric conditions, and healthy variation.
Diffusion MRI extends structural mapping by estimating how water molecules move through tissue. In white matter, diffusion is constrained by bundles of axons, allowing researchers to infer the orientation of major pathways. Basser, Mattiello, and LeBihan’s 1994 work provided the theoretical basis for diffusion tensor imaging and modern tractography. The resulting images can suggest how distant regions are connected, but they are mathematical reconstructions rather than direct photographs of individual fibers. Crossing pathways, limited resolution, motion, and analytical choices can alter the apparent course or strength of a tract.
Functional Imaging and the BOLD Signal
Functional magnetic resonance imaging, or fMRI, maps changes in blood oxygenation associated with neural activity. Seiji Ogawa and colleagues demonstrated that magnetic resonance contrast could detect differences related to oxygenated and deoxygenated blood, laying the foundation for blood oxygen level–dependent imaging. BOLD fMRI does not record neurons firing directly. It measures a delayed vascular response following local changes in neural activity. Researchers compare signals across tasks, conditions, or time periods to identify statistically meaningful patterns. Its combination of whole-brain coverage and relatively strong spatial detail made fMRI a defining tool of cognitive neuroscience.
Positron emission tomography, or PET, uses radiolabeled compounds to measure metabolism, blood flow, or molecular targets. PET studies helped establish that the resting brain is not inactive. In 2001, Marcus Raichle and colleagues described regions that consistently decreased activity during demanding tasks relative to an active baseline, helping define the default mode network. This work encouraged researchers to treat spontaneous brain activity as an organized feature rather than meaningless background noise. Functional mapping consequently expanded beyond task activation to include intrinsic activity during rest, reflection, memory, and internally directed thought.
Networks, Connectivity, and the Connectome
Resting-state fMRI examines slow fluctuations in the BOLD signal while a person is not performing a controlled task. In a landmark 1995 study, Bharat Biswal and colleagues showed that separated parts of the motor system remained correlated during rest. This finding helped establish functional connectivity as a major field. Similar methods have identified networks associated with vision, movement, attention, executive control, salience, and internally directed cognition. These correlations do not prove that two regions communicate directly, but they reveal reproducible relationships that help describe the brain as an integrated system.
The connectome represents the effort to map the brain’s structural and functional relationships. The Human Connectome Project advanced this goal by collecting multimodal MRI, magnetoencephalography, and behavioral data while sharing datasets and analytical tools. Using project data, Glasser and colleagues combined architecture, function, connectivity, and topography to delineate 180 cortical areas in each hemisphere. Their work demonstrated that contemporary atlases can integrate several biological signals rather than rely on one anatomical feature. It also showed how standardized, openly available datasets can make brain maps more detailed, testable, and useful.
Mapping the Brain in Time
MRI-based methods are valuable for locating activity, but neural events unfold much faster than the vascular response measured by fMRI. Electroencephalography records voltage differences generated by populations of neurons, while magnetoencephalography measures their magnetic fields. Both can follow activity on the scale of milliseconds, making them useful for studying the sequence of perception, attention, language, decision-making, and movement. When EEG or MEG data are combined with structural MRI, researchers can estimate where signals originated and how activity spread through large-scale networks.
Source localization remains difficult because many neural configurations can produce similar measurements outside the skull. This is known as the inverse problem, and solutions depend on assumptions about anatomy, noise, source orientation, and signal distribution. Even with these limitations, high-density EEG and MEG have become important clinical tools, particularly in epilepsy. They can help localize abnormal discharges, identify seizure networks, and guide evaluation for surgery. Their temporal precision complements MRI’s anatomical detail, showing why combining methods often produces a more informative map than relying on one technique.
Clinical Applications and Practical Limits
Neuroimaging is embedded in clinical neurology and neurosurgery. Structural MRI can reveal tumors, strokes, malformations, inflammation, atrophy, and traumatic injury, while diffusion imaging can show damage to white-matter pathways. Functional mapping is often used before surgery to estimate the location of motor, sensory, and language systems near a lesion. This information can help surgeons remove abnormal tissue while preserving movement, speech, and comprehension. Studies of presurgical language mapping demonstrate both the value of fMRI and the challenge posed by individual variation and functional reorganization.
Brain mapping also supports research into Alzheimer’s disease, Parkinson’s disease, epilepsy, schizophrenia, depression, autism, multiple sclerosis, and other conditions. Yet most imaging findings are not standalone diagnostic tests. Group differences may reveal mechanisms without accurately classifying every patient. Medication, motion, sleep, vascular health, age, scanner differences, and analytical choices can influence results. Clinical interpretation must therefore be integrated with symptoms, neurological examination, cognitive testing, laboratory findings, and medical history. A scan can reveal meaningful biological patterns, but it cannot explain a person’s condition or experience by itself.
Reproducibility and the Future of Brain Mapping
Neuroimaging produces persuasive pictures, but those pictures are heavily processed. Researchers correct motion, align scans, smooth signals, define regions, select thresholds, and model noise. In 2016, Anders Eklund, Thomas Nichols, and Hans Knutsson showed that commonly used cluster-based fMRI procedures could produce inflated false-positive rates under certain conditions. The study reinforced an essential point: brain maps are statistical inferences, not transparent photographs of mental activity. Reliable mapping depends on validated methods, adequate samples, replication, transparent reporting, careful quality control, and open data.
The field is moving toward larger datasets, repeated measurements, higher-resolution scanners, improved molecular tracers, portable sensors, machine learning, and individualized models. Poldrack and colleagues’ intensive mapping of one person across 18 months illustrated how repeated imaging can reveal patterns hidden by one-time group comparisons. Precision neuroimaging may eventually distinguish stable individual organization from changes related to sleep, stress, learning, hormones, medication, or disease. The deeper advance is conceptual: the brain is increasingly understood not as a collection of fixed centers but as a dynamic, adaptive network whose organization depends on context, development, and experience.